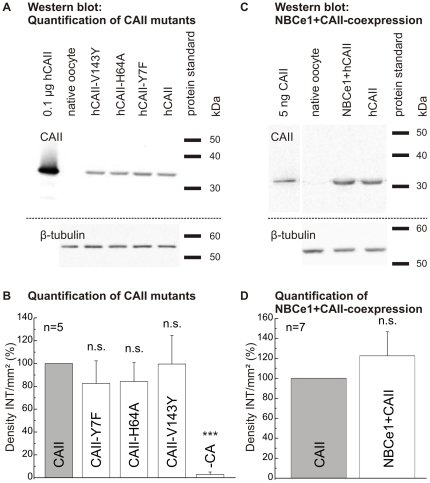
Figure 7. Quantification of CAII mutants.
Western blot of the different CAII mutants (CAII-Y7F, CAII-H64A and CAII-V143Y) as well as wild-type CAII (A; 12 µg total protein/lane), β-tubulin was used as loading control, and quantification of the expression of the CAII mutants in oocytes, as compared to wild-type by determination of the density of intensity (B; Density INT/mm2). Western blot of CAII-expressing and NBCe1+CAII-coexpressing oocytes, with β-tubulin used as loading control (C; 15 µg total protein/lane) and quantification of effect of NBCe1 coexpression on CAII expression rate (D).

