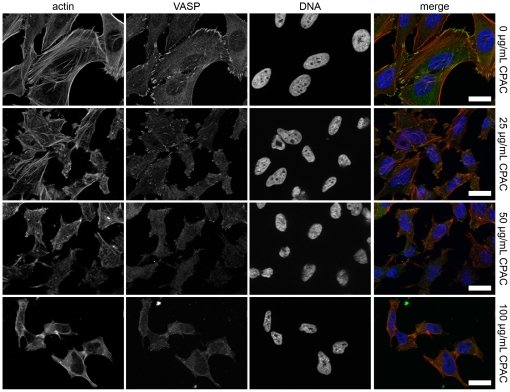
Figure 4. Assessment of the effect of CPAC on the host cell cytoskeleton.
HeLa cells were exposed to three concentrations of CPAC for 4 hours before using immunofluorescence to visualize cell structure. Cells were stained for actin (red, left), for vasodilator-stimulated phosphoprotein (VASP, green, second column), and DAPI (blue, third column). A colour composite image is shown in the right column. Control experiments (top panels) demonstrate normal actin arrangement as well as localization of VASP protein to the focal adhesion points. In a dose-dependent manner, actin arrangement is disrupted, in parallel with the delocalization of the VASP protein from the focal adhesion points as established by the second (25 µg/mL CPAC), third (50 µg/mL CPAC) and fourth (100 µg/mL CPAC) rows. The effect on the actin cytoskeleton is similar to the effect seen in Figure 1. Scale bars indicate 25 µm.

