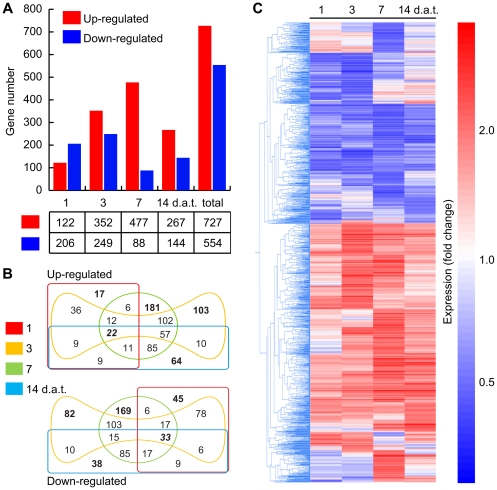
Figure 1. Overview of N-isobutyl decanamide responsive genes in Arabidopsis seedlings.
Number of genes (vertical axis) Up-regulated (red) and Down-regulated (blue) by N-isobutyl-decanamide treatment at 1, 3, 7, and 14 d.a.t. (A). Edwards-Venn diagrams showing common or distinct responsive genes identified at every time evaluated (B). The number of genes up- or down-regulated in a single condition is shown in bold letters. The number of genes regulated at all sampled-times are shown in bold italic font. Agglomerative hierarchical clustering of differentially expressed genes at every sampled times (C). Clustering was performed using the Smooth correlation and average linkage clustering in GeneSpring GX 7.3.1 software (Agilent Technologies®). Blue color indicates Down-regulated, red Up-regulated and white unchanged values, as shown on the color scale at the right side of the figure.

