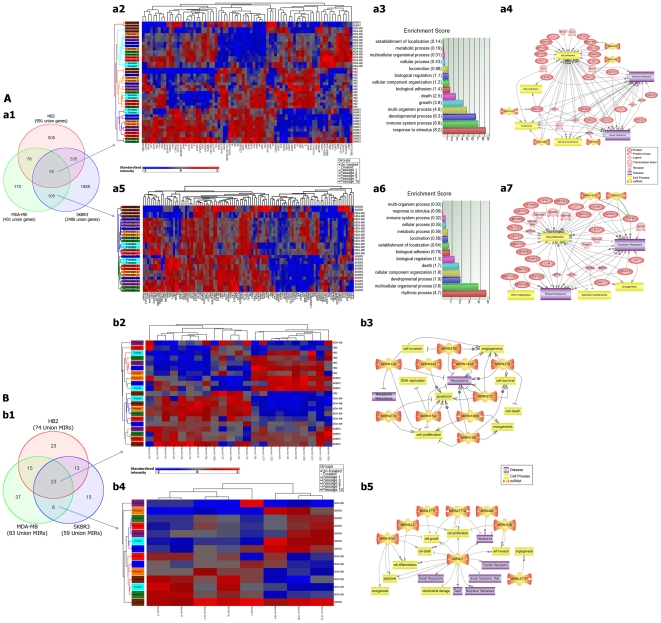
Figure 2. Gene and micoRNA expression matrix.
A) Gene expression of HB2, MDA-MB231 and SKBR3 cell lines. a1) The total number of significant up/down-regulated genes within three analyzed cell lines. a2) Expression profiles of 78 intersection genes among all three cell lines as non-cancer specific changes. a3) Gene set analysis of 78 intersection genes. a4) Pathway analysis of 30 out of 78 genes that are linked to breast neoplasms, metastasis and/or cell proliferation. a5) Expression profiles of 105 intersection genes between MDA-MB231 and SKBR3 as cancer specific changes. a6) Gene set analysis of 105 intersection genes. a7) Pathway analysis of 36 out of 105 genes that are linked to breast neoplasms, metastasis and or cell proliferation. B) MicroRNA expression of HB2, MDA-MB231 and SKBR3 cell lines. b1) The total number of significant up/down-regulated miRNAs within three analyzed cell lines. b2) Expression profiles of 23 intersection miRNAs among all three analyzed cell lines as non-cancer specific changes. b3) Pathway analysis of 10 out of 23 miRNAs that are linked to breast neoplasms, metastasis and/or cell proliferation. b4) Expression profiles of 8 intersection miRNAs between MDA-MB231 and SKBR3 as cancer specific changes. b5) Pathway analysis of all 8 miRNAs as cancer specific changes that are linked to breast neoplasms, metastasis and or cell proliferation.

