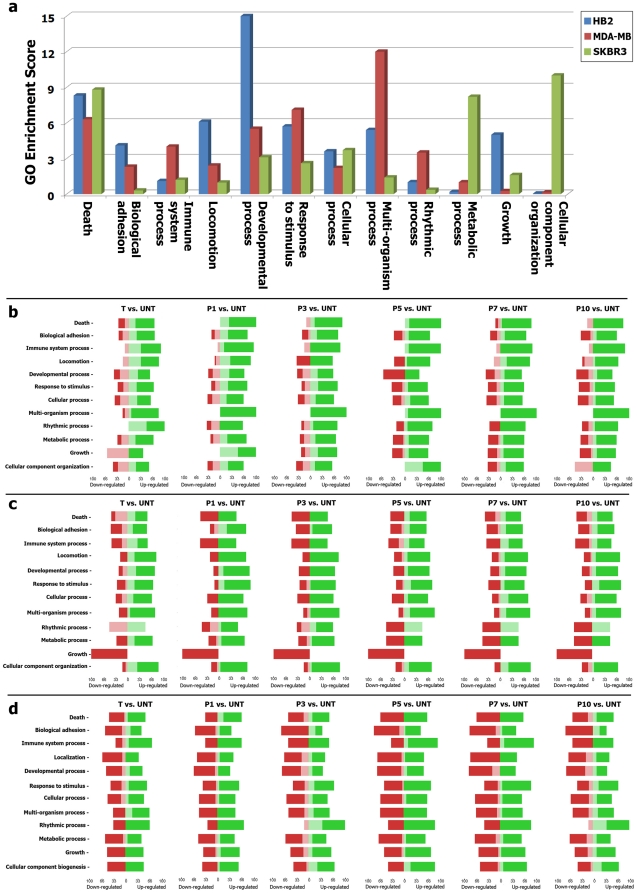
Figure 3. Gene ontology analysis.
a) Gene set analysis and GO enrichment score for union genes of three cell lines. If a functional group had an enrichment score over 1, the functional category was over expressed. A value of 3 or higher corresponds to significant over expression (chi-square test; P<0.05). b) Forest plot analysis shows up/down-regulated of HB2 union genes based on their ontology enrichment. c) Forest plot analysis of MDA-MB231 union genes. d) Forest plot analysis of SKBR3 union genes.

