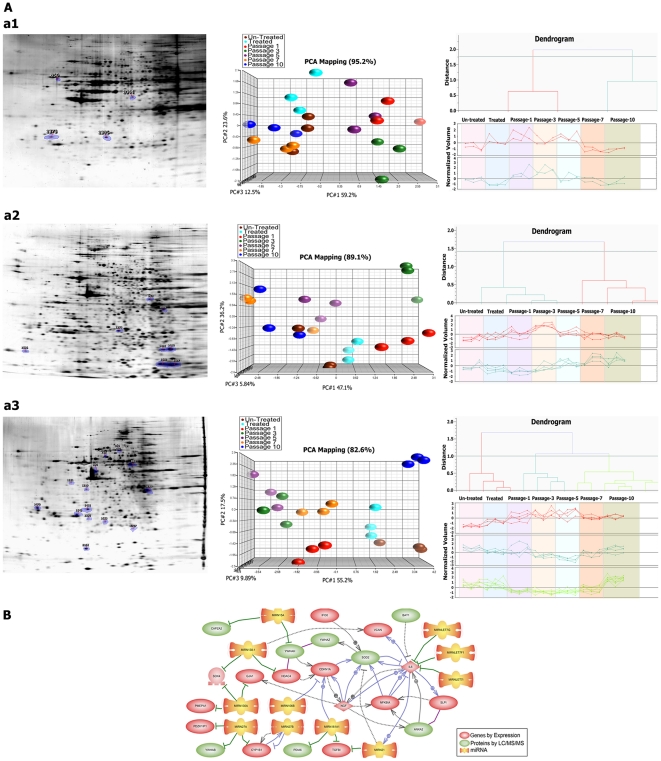
Figure 4. Protein expression matrix.
A) Proteomics analysis of three cell lines. (a1 – a3 left panel) Proteomic images of representative gels of the three cell lines HB2, MDA-MB231 and SKBR3 with indicated spot positions excised for mass spectrometry analysis; spot picking performed from up/down-regulated intersection proteins. (a1 – a3 middle panel) PCA analysis of intersection proteins from treated cells and follow up passages 1, 3, 5, 7 and 10 from three cell lines. (a1 – a3 right panel) Clustering and classification of significantly up/down-regulated proteins based on their profiles throughout the passages. B) Crosstalk between 3-dimensional Omics. Prediction of the possible interactions and links between intersection genes, miRNAs and proteins.

