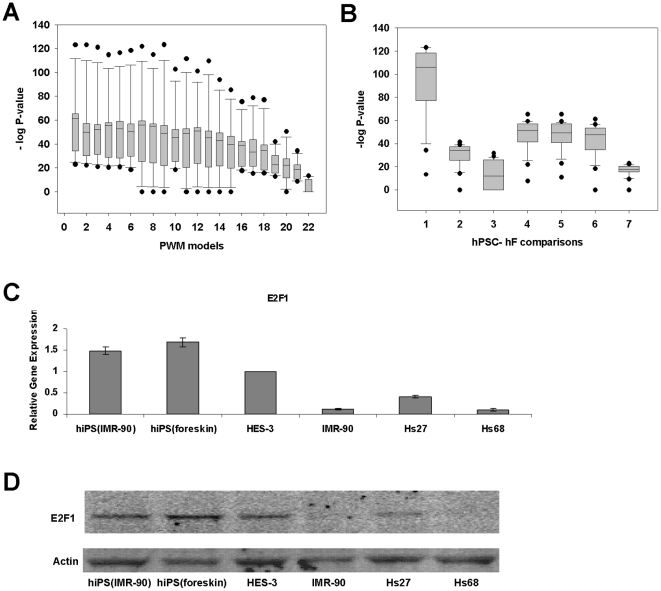
Figure 2. Significant E2F activity and E2F1 differential expression between hPSCs and hFs.
(A) Box plots depicting statistical significance of TFA for all 22 TRANFAC PWMs, based on 7 hPSC-hF comparisons. (B) Box plots summarizing statistical significance of TFA for 7 hPSC- hF comparisons, based on 22 PWMs. Median −log10(P-value) is greater than 10 for most hPSC-hF comparisons. The whiskers represent 10th and 90th percentiles while the circles outside them are outliers. (C) Quantitative Real-time PCR analysis of gene expression in hPSCs [iPS(IMR90), iPS(foreskin) and HES-3] and hFs [IMR-90, Hs27 and Hs68]. Gene expression was normalized to that of GAPDH and expressed as fold change relative to HES-3. The values shown are mean ± SD of a representative experiment performed in triplicate and repeated twice for each biological replicate (cell line). (D) Verification of up-regulation of the TF in hPSCs compared to hFs. Actin served as loading control.

