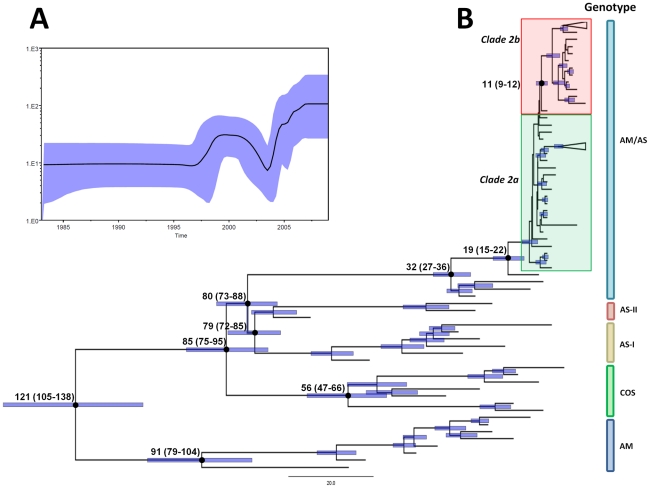
Figure 3. Maximum clade credibility (MCC) tree and Bayesian Skyline plot of the analyzed DENV-2.
A) Bayesian coalescent inference of genetic diversity and population dynamics using the Bayesian Skyline plot available in BEAST 1.6.1., for DENV-2 strains of American/Asian genotype in Central America. X axis represents years of study and y axis the relative genetic diversity product of the effective population size. Black line represents the mean estimate and the blue shadow, the 95%HPD. B) Maximum clade credibility tree derived from the Bayesian analysis of the envelope protein of DENV-2 with the best fit model (relaxed lognormal clock), showing the mean time to the most recent common ancestor (TMRCA) in each principal node (mean and 95%HPD). The 95% highest probability density (95%HPD) for each node age, are shown as blue bars. DENV-2 genotypes (Sylvatic, American, Asian I and II, Cosmopolitan and American/Asian) are identified. Clades 2a and 2b are highlighted in a green and red shadow, respectively.

