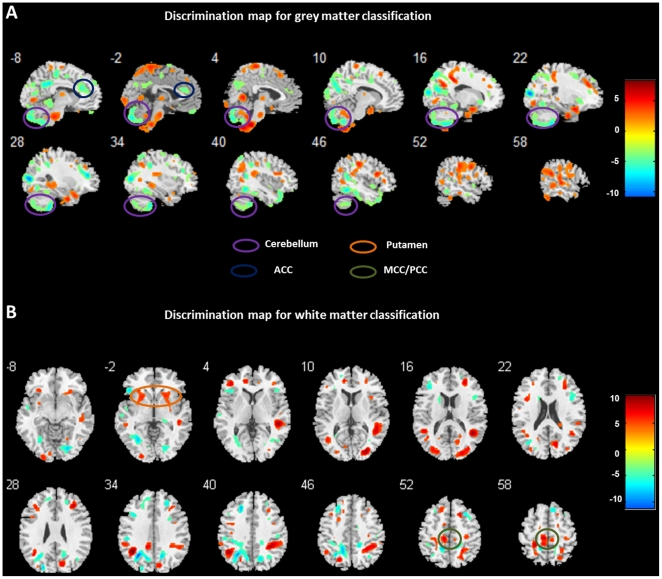
Figure 3. Discrimination map for grey (A) and white matter (B) classification.
Red indicates higher values in the smokers than non-smokers, while blue indicates higher values for the non-smoker group than the smoker group. These regions were identified by setting the threshold to the top 30% of the weight vector scores. The x-coordinate for each sagittal slice and y-coordinate for each coronal slice in the standard Talairach space are given in millimetres.

