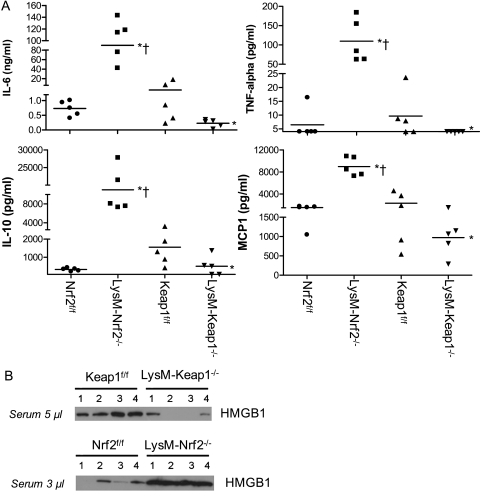
Figure 3.
LysM–Keap1−/− mice are associated with markedly low systemic inflammation compared with LysM–Nrf2−/− and control floxed mice after CLP. (A) Serum cytokines (IL-6, tumor necrosis factor [TNF]-α, IL-10, and monocyte chemoattractant protein-1) in mice alive at 24 hours after CLP (22-guage, a less severe CLP model) as assessed by microarray immunoassay. Data were represented as scatter plot, and each point represents an individual mouse. The horizontal line represents mean value. Data were analyzed by U test and Student t test. *Significant compared with flox control group; P < 0.05. †Significant compared with LysM-Keap1−/− group; P < 0.01. (B) Serum high mobility group 1 levels in mice 24 hours after CLP as analyzed by immunoblot. Each band represents the level of HMGB1 in an individual mouse. For this analysis, 5 μl of serum from Keap1f/f and LysM-Keap1−/− mice and 3 μl of serum from Nrf2f/f and LysM-Nrf2−/− was used.

