Figure 2.
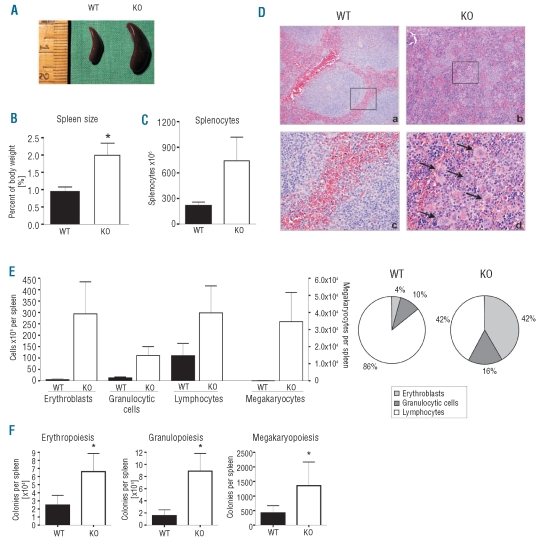
Splenomegaly and extra medullary hematopoiesis in the spleen of NFATc2−/− mice. (A) Splenomegaly in an exemplary KO mouse with ossified bone marrow. (B) The spleens of KO mice were twice as heavy as those of WT mice. Data are presented as mean ± SEM. N = 6. *P<0.05. (C) The number of splenocytes was increased in KO mice. Data are presented as mean ± SEM. N = 6. (D) Exemplary hematoxylin-eosin stained sections of the spleen of WT and KO mice. The normal architecture of the parenchyma (a) is destroyed in NFATc2−/− mice (b). Magnification: 100x. (c, d) closer magnification (400x) of (a, b). Note the presence of megakaryocytes (arrows). (E) Differential of spleen cells. Cells of the erythroid, granulocytic, lymphocytic, and megakaryocytic lineages were increased in aged KO mice, whereas the percent increase of erythrocytes and granulocytes was greater than that of lymphocytes (pie chart). Results are given as mean ± SEM. N = 6. (F) Number of hematopoietic colonies (CFU-G, CFU-M, CFU-GM, BFU-E, CFU-MK) derived from 1x10⁵ cells of the spleen. Three mouse pairs were analyzed. Results are given as mean ± SEM.

