Figure 1.
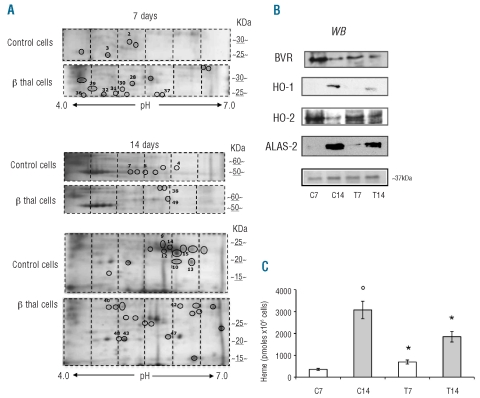
β-thalassemic erythroid precursors show increased oxidative stress, reduced biliverdin reductase/ heme-oxygenase 1 expression and heme content. (A) Two-dimensional (2D) gel analysis of erythroid precursors from normal (control) and β-thalassemic (β thal cells) subjects at 7 and 14 days of culture. The images show representative gels of ten others with similar results. The differently expressed spots were identified (black circle) by image analysis, excised from the colloidal Coomassie-stained gels and analyzed by mass spectrometry (see also Design and Methods and Online Supplementary Design and Methods). Spot numbers correspond to those reported in Table 1. (B) Immunoblot analysis of BVR, HO-1, HO-2 and ALAS-2 in normal (C7, C14) and β-thalassemic (T7 and T14) cells. We showed on the colloidal Coomassie-stained gel the band at ~ 37 kDa used as a loading control and identified by mass spectrometry as the glycerol 3P-dehydrogenase cytoplasmic domain (Acc. n: P21695, 12% sequence coverage). One representative gel of ten others with similar results is presented. (C) Intracellular heme levels in normal (white bars: C7, C14) and β-thalassemic (gray bars: T7 and T14) erythroid cells. Experiments were repeated in triplicate, the error bars represent the S.E.M.

