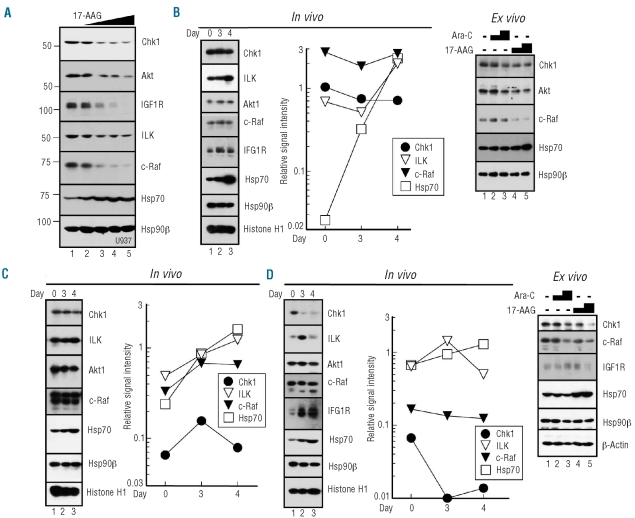
Figure 2.
Effects of treatment on client protein levels. (A). After U937 cells had been treated for 24 h with diluent (0.1% DMSO, lane 1) or tanespimycin at 30, 100, 300 or 1000 nM (lanes 2–5), whole cell lysates were subjected to SDS-polyacrylamide gel electrophoresis followed by immunoblotting. Numbers on the left are molecular weight markers in kDa. (B-D) Marrow mononuclear cells from patients exposed to tanespimycin in vivo at (B) dose level 3, (C) dose level 4 or (D) dose level 1. In each case whole cell lysates were isolated from marrows harvested prior to treatment (day 0), after 48 h of cytarabine (day 3) and 22±2 h after tanespimycin administration (day 4). Polypeptides from 0.5–5x10⁵ HL-60 cells were included on each gel to provide a standard curve for quantitating signals.35 Hsp90β and Histone H1 represent two loading controls. After immunoblotting, digitized signals were normalized for histone H1 content and compared to HL-60 cell dilutions. A value of 1.0 indicates the same antigen signal as an equal number of HL-60 cells. In panels (B) and (D), pretreatment marrow mononuclear cells from the same patients were also prospectively exposed ex vivo to diluent (0.1% DMSO), 300 nM cytarabine, 1000 nM cytarabine, 300 nM tanespimycin, or 1000 nM tanespimycin (lanes 1–5, respectively) for 24 h and subjected to immunoblotting. Cells for ex vivo exposure were not available from the patient in panel (C).

