Figure 2.
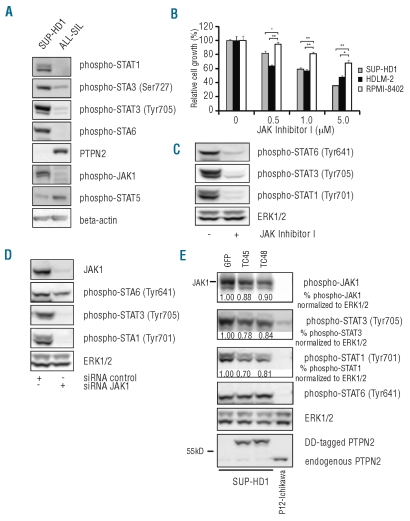
SUP-HD1 cells show constitutive activation of the JAK/STAT pathway. (A) Identification of constitutively activated JAK/STAT proteins in SUP-HD1 by Western blot analysis of WCL. T-ALL cell line ALL-SIL is known to harbor no genetic abnormality of the PTPN2 gene locus and is shown as control.3 (B) SUP-HD1 and HDLM-2 cells showed sensitivity to JAK inhibitor I. HDLM-2 cells feature a deletion and mutation in the SOCS1 gene and JAK2 amplification causing sensitivity to JAK/STAT inhibition,14,17 whereas RPMI-8402 cells display no activated JAK/STAT pathway and were used as negative control. Y axis represents cell growth relative to respective DMSO treated control recorded 72 h after treatment initiation and bars show average ± s.e.m. n=3; *P<0.05, **P<0.005. (C) Western blot analysis of SUP-HD1 cells upon exposure to JAK inhibitor I (1 μM) demonstrated dephosphorylation of JAK1 downstream targets STAT1, STAT3 and STAT6. ERK1/2 is shown as loading control. (D) Downregulation of JAK1 protein levels using human JAK1 targeting short interfering RNA (siRNA JAK1) resulted in a profound effect on the activation status of STAT family members STAT1 and STAT3 and a slightly minor effect on STAT6 phosphorylation. Equal amount of total protein was assured by detection of ERK1/2. (E) Re-expression of inducible forms of PTPN2 (DD-tagged) resulted in decreased JAK1 phosphorylation, and inhibition of STAT1 and STAT3 activation. GFP fused to the destabilizing domain was used as negative control. Normalized quantification values of phosphorylation levels calculated as relative change compared to GFP-transduced control cells are shown below respective blots. T-ALL cell line P12-Ichikawa was included as control with normal PTPN2 protein expression level. Loading control: ERK1/2.

