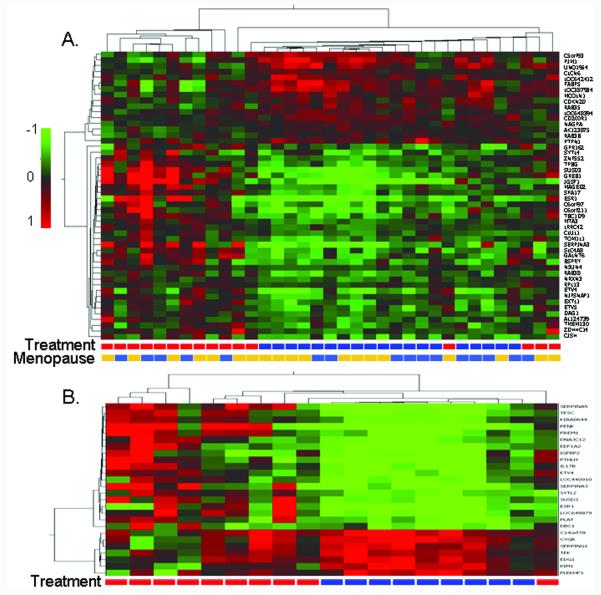
Figure 2.
A) Hierarchical clustering for genes whose expression was significantly modulated by tamoxifen but not placebo in breast core biopsies. Premenopausal and postmenopausal samples were combined in this analysis which used Benjamin-Hockberg-corrected P < 0.05 as the initial selection criteria. Treatment:  placebo,
  tamoxifen; Menopause is menopausal status:
  premenopausal,
  postmenopausal. B) Hierarchical clustering for genes whose expression was significantly modulated by tamoxifen but not placebo in breast core biopsies for premenopausal subjects only. Group:
  placebo,
  tamoxifen. The color scale is based on the Log2 ratio (post-treatment/baseline).

