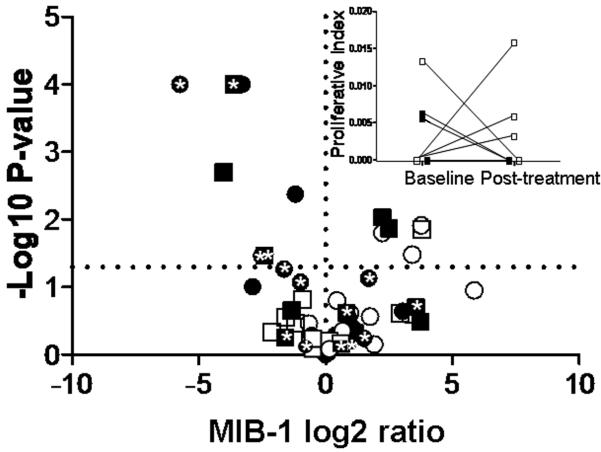
Figure 5.
Volcano plot showing modulation of proliferation for each subject. The X-axis is the MIB-1 Log2 Ratio (post-treatment/baseline) and the Y-axis is the −Log10 for the P-value for each individual. The horizontal dashed line corresponds to P = 0.05. Negative Log2 Ratio values correspond to treatment-related reductions in proliferation and positive values to increased proliferation. Black symbols are tamoxifen subjects and white symbols placebo subjects. Circles are premenopausal subjects and squares postmenopausal subjects. * designates tamoxifen subjects with a CYP2D6 *4 or *5 poor metabolizer allele. The inset shows mean baseline and post-treatment proliferation indices for the 9 postmenopausal subjects with a proliferative index of zero at one or both time points. These subjects cannot be rendered on the volcano plot which requires Log2 transformations. Both baseline and post-treatment proliferative indices were zero for three of the tamoxifen subjects.

