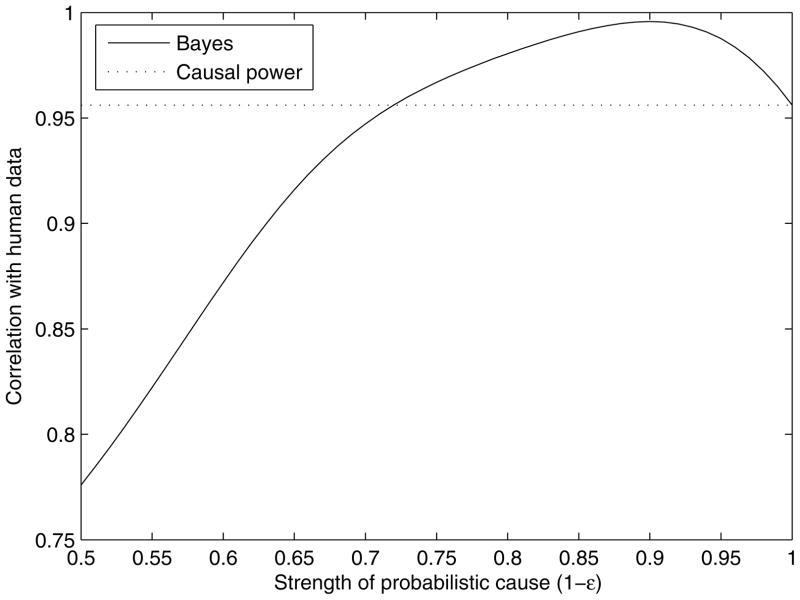
Figure 6.
Correlation of the Bayesian model with human responses as a function of the strength of the probabilistic cause, corresponding to 1− ε. For a range of values of ε consistent with relatively strong causal relationships, this correlation is greater than the correlation produced by causal power, shown with the dotted line.

