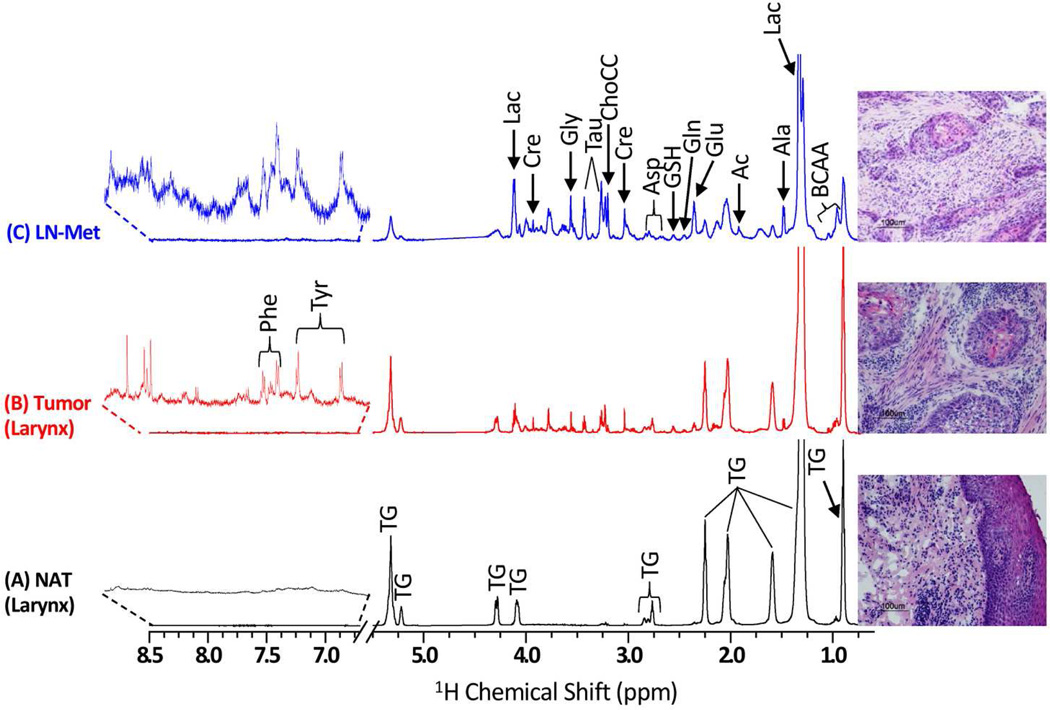
Figure 2.
Representative 600 MHz 1H CPMG NMR spectra (area normalized) of (A) NAT, (B) Tumor and (C) LN-Met tissues taken from a single patient. The intensity of peaks in the chemical shift region 6.7 – 8.5 ppm was increased equally in all spectra to show the low-abundant taurine and phenylalanine. The corresponding H&E photomicrographs of post HR-MAS NMR tissues are shown alongside of each 1H CPMG spectrum.

