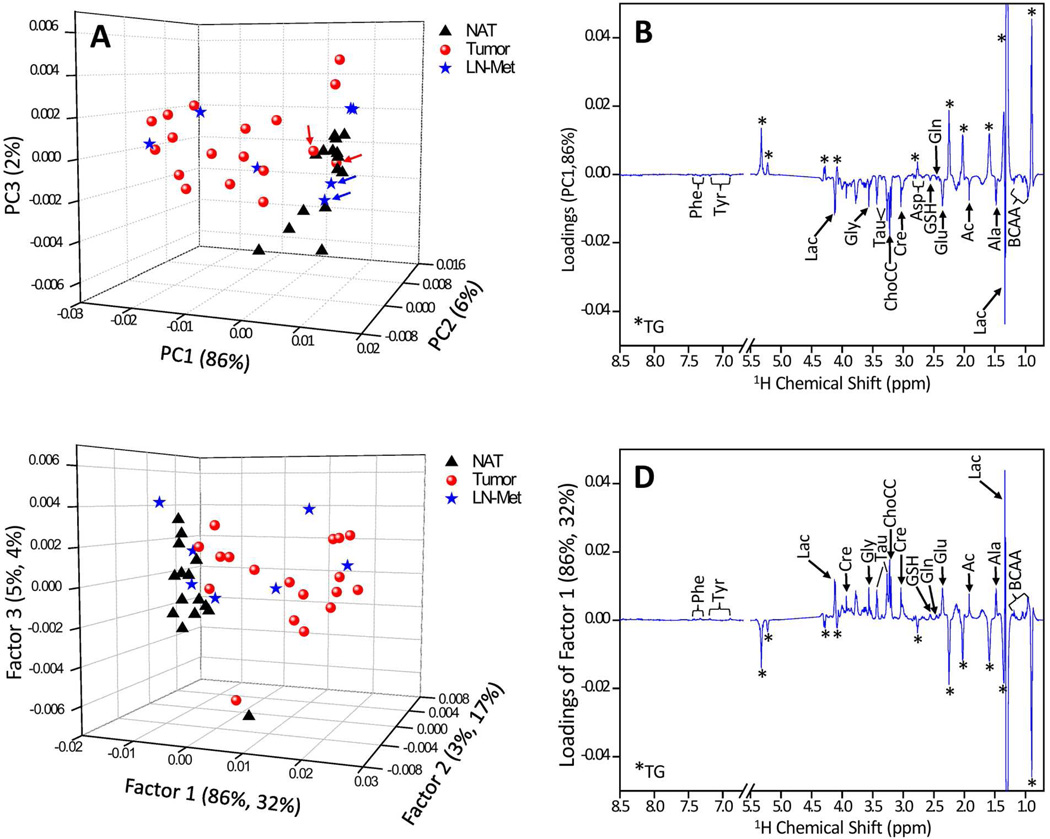
Figure 3.
(A) Unsupervised PCA and the corresponding (B) PC1 loadings, (C) PLS-DA and the corresponding (D) PC1 loadings of a total of 40 tissues generated from 15 NAT, 18 Tumor and 7 LN-Met tissues. It can be seen that primarily PC1 was responsible for the separation between NAT and tumor tissues; however, LN-Met tissues overlap with tumors. In PCA score plot, the tumor and metastatic tissues which were overlapping with that of NAT (indicated by red and blue arrows) are diagnosed as poorly differentiated squamous cell carcinoma. In the case of PLS-DA score plot (B), LN-Met tissues are indicated in different colors despite the analysis was carried out by considering LN-Met tissues as tumor.

