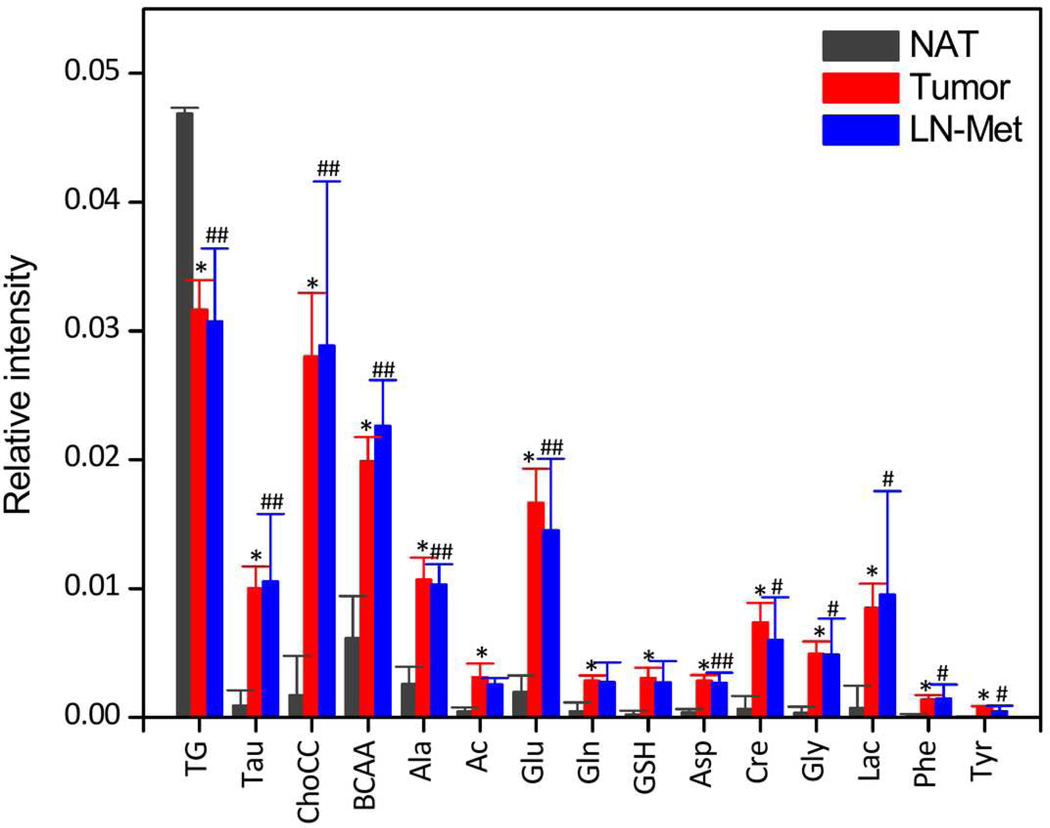
Figure 5.
Relative intensities (mean ± SEM) of triglycerides and metabolites obtained from normalized CPMG NMR spectra along with univariate statistical analysis (Mann-Whitney). * P < 0.001: NAT Vs Tumor; # P < 0.05: NAT Vs LN-Met; ## P < 0.01: NAT Vs LN-Met. There is no significant difference in the level of metabolites identified from tumor and LN-Met samples.

