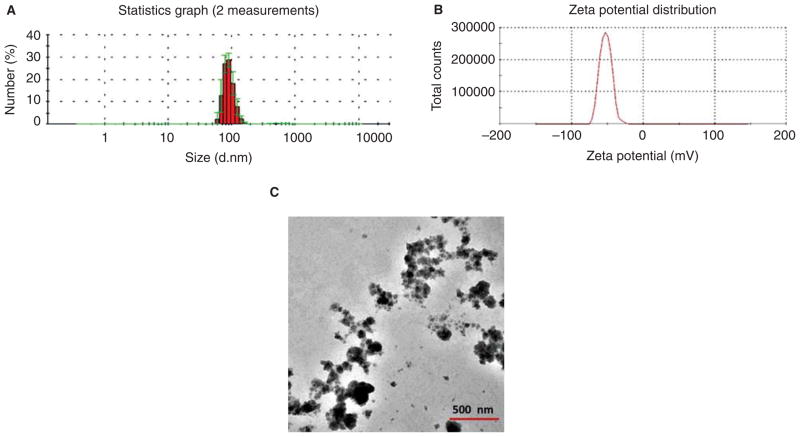
Figure 1.
Characterization of CeO2 nanoparticles. (A) Hydrodynamic size distribution of CeO2 suspension obtained by two independent measurements, showing an average size of 90 ± 20 nm (shown in red). The standard deviations are shown in green. (B) Zeta potential of CeO2 suspension, indicating an average value of −52.7 mV. (C) TEM image of dehydrated CeO2 suspension. A solution of 1 μg/μl CeO2 was used for characterization.

