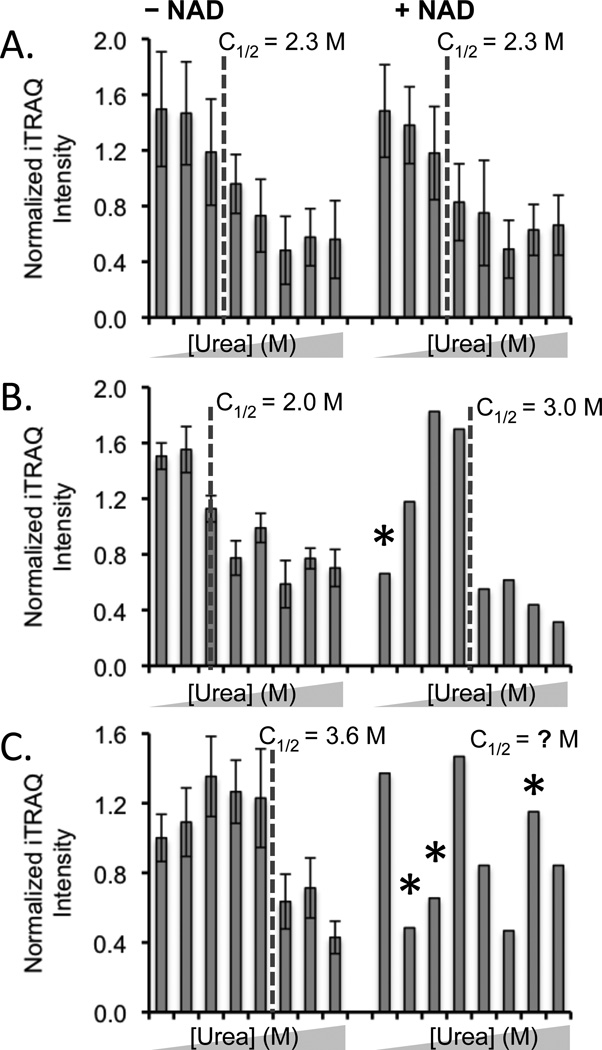
Figure 3.
Typical SPROX data obtained in the NAD+ binding experiment. (A) SPROX data obtained on the TVPFVPISGWNGDNMIEATTNAPWYK peptide from the Tef2p protein did not display NAD+ binding. (B) SPROX data obtained on the GDIESISDKTMYK peptide from NAD+-dependent glutamate dehydrogenase, a protein that did display NAD+ binding. (C) SPROX data obtained on the STAISLYSEMSDEDVKEIK peptide from Eft2p, that has an uninterpretable data set in the presence of NAD. The urea concentrations in each data set were (from left to right) 0, 1.0, 2.0, 2.7, 3.3, 4.0, 4.9, and 6.0 M. Error bars representing ± one standard deviation are shown in cases were the data from multiple product ion spectra were averaged. Error bars are not shown in the (+) NAD data in (B) and (C) because the data were obtained from a single product ion scan. An asterisk represents an outlying data point (see Experimental).

