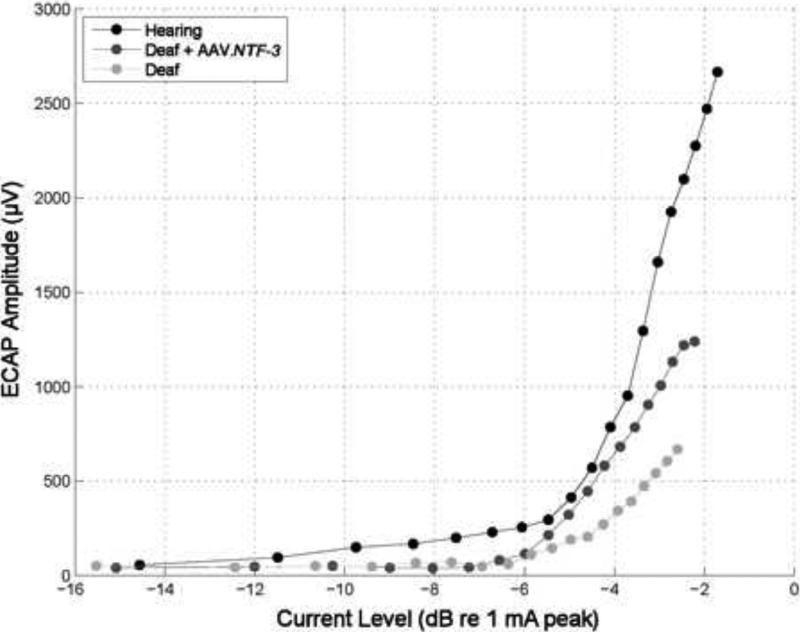
Fig. 5.
Electrically-evoked compound action potential (ECAP) input/output functions for the three animals for which histology is given in Fig. 3. Potentials were evoked by monopolar stimulation of Electrode B and recordings were made from Electrode A. Stimuli were 25 μs/phase biphasic pulses of alternating initial-phase polarity presented at 50 pps, delivered using a MED-EL Pulsar ci100 receiver/stimulator connected to the implant through a percutaneous connector. ECAP amplitudes were calculated as the peak to peak voltages: P2 (latency ~0.3 ms) minus N2 (latency ~0.8 ms) from waveforms averaged over 20 pulses. The differences in slopes of the ECAP input/output functions across the three conditions shown here have been duplicated in preliminary data from experiments currently in progress involving three hearing animals, four deafened AAV.NTF-3 inoculated animals and two deafened AAV.empty inoculated animals.

