Figure 2.
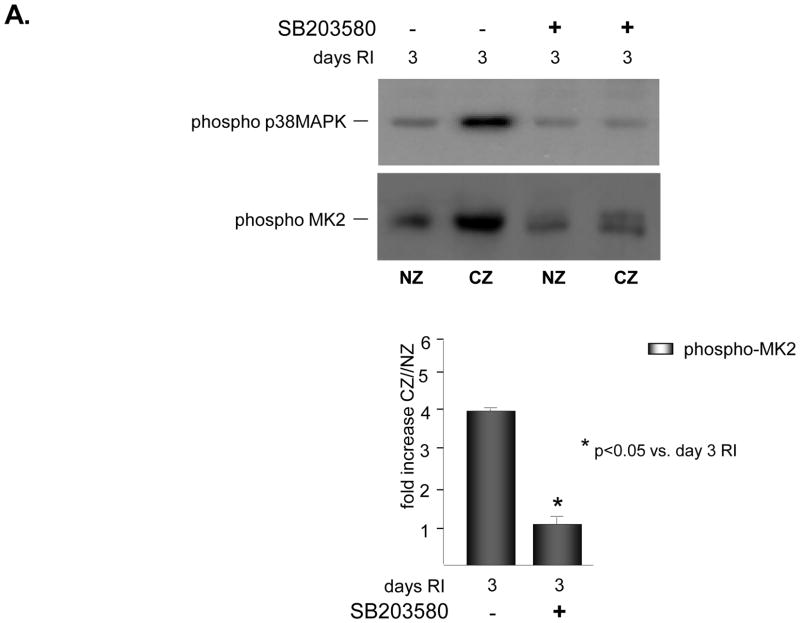
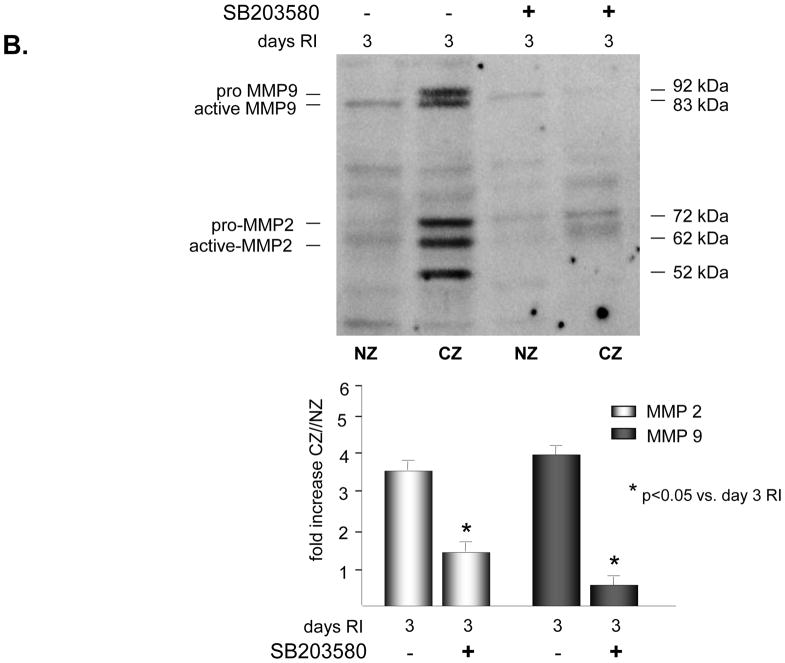
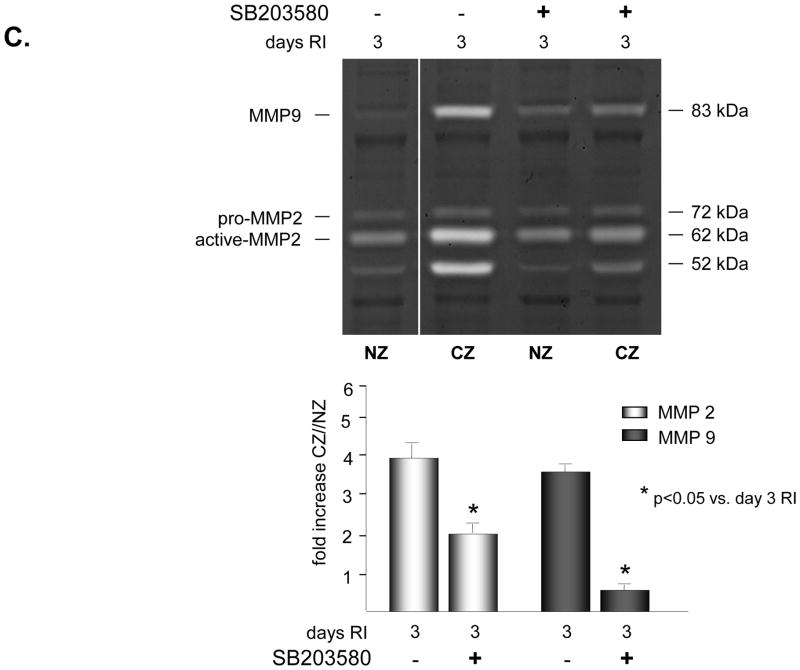
SD rats were treated with the p38 MAPK inhibitor, SB203589 as indicated, and sacrificed on day 0 or 3 of RI. Tissue samples were collected from the non-ischemic normal zone (NZ) or the ischemic LAD/collateral-dependent zone (CZ). MMP expression and MK2 activation were determined by Western Blot and MMP activity by zymography. A. Top: Representative Western blot using phospho-specific anti-MK2 antibodies. Bottom: Cumulative data, *p<0.05, n=5. B. Top: Representative Western blot using anti-MMP 2 and 9 antibodies. Bottom: Cumulative data, *p<0.05, n=5. C. Top: Representative gelatin zymogram for MMP 2 and 9 (all lanes are from the same gel). Bottom: Cumulative data, *p<0.05, n=5.


