Figure 4.

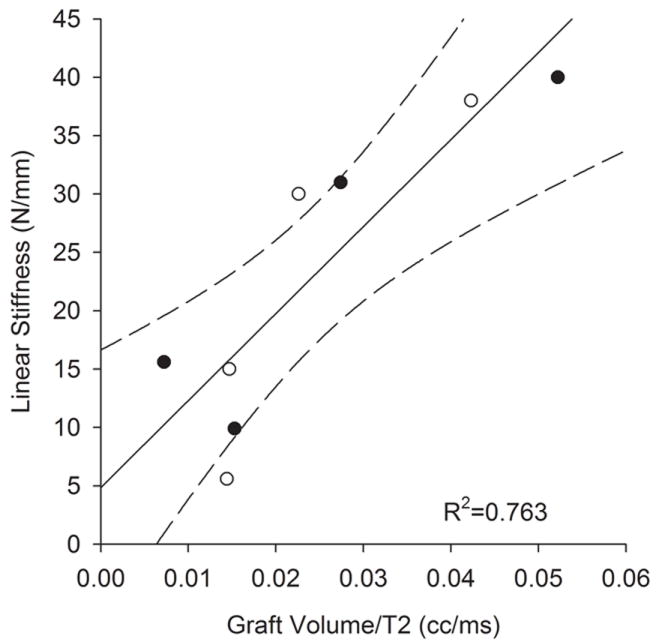
Graft linear stiffness after 6-weeks of graft healing was proportional to the graft volume when normalized by the T2 relaxation signal. Solid line represents the linear regression while dashed lines represent 95% confidence intervals.

Graft linear stiffness after 6-weeks of graft healing was proportional to the graft volume when normalized by the T2 relaxation signal. Solid line represents the linear regression while dashed lines represent 95% confidence intervals.