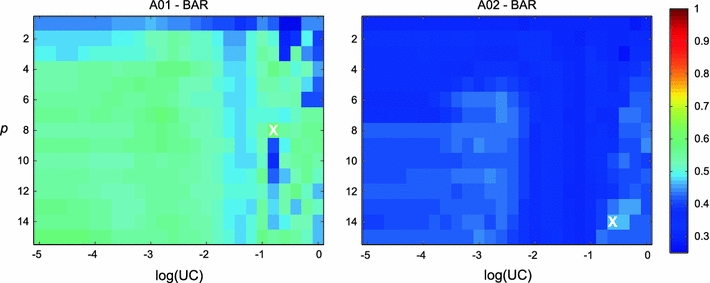
Fig. 1.

Optimization results for subjects A01 (left) and A02 (right) for BAR with the best bilinear model order q. Maps show the 0.9 quantile of the classification accuracy for all parameter combinations of log(UC) (x-axis) and model order p (y-axis). The white cross marks the location of the maximum
