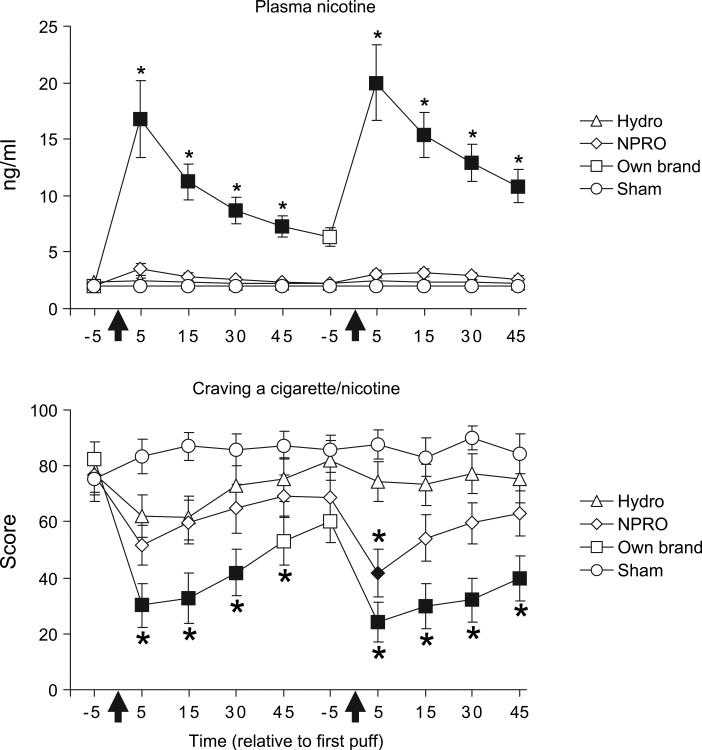
Figure 1.
Mean (±1 SEM) plasma nicotine (top panel; assay's limit of quantitation=2 ng/ml) and response to a visual analogue scale item assessing ‘craving for a cigarette/nicotine’ (bottom panel; 0–100 scale) from 16 cigarette smoking participants who each abstained from tobacco/nicotine for at least 12 h before completing each of the study's 4 conditions. Arrows indicate timing of product administration (each administration consisted of 10 puffs with a 30-s interpuff interval). Filled symbols indicate a significant difference from the first assessment timepoint; asterisks (*) indicate a significant difference from sham smoking at each timepoint (ps<0.05; Tukey honestly significant difference test).

