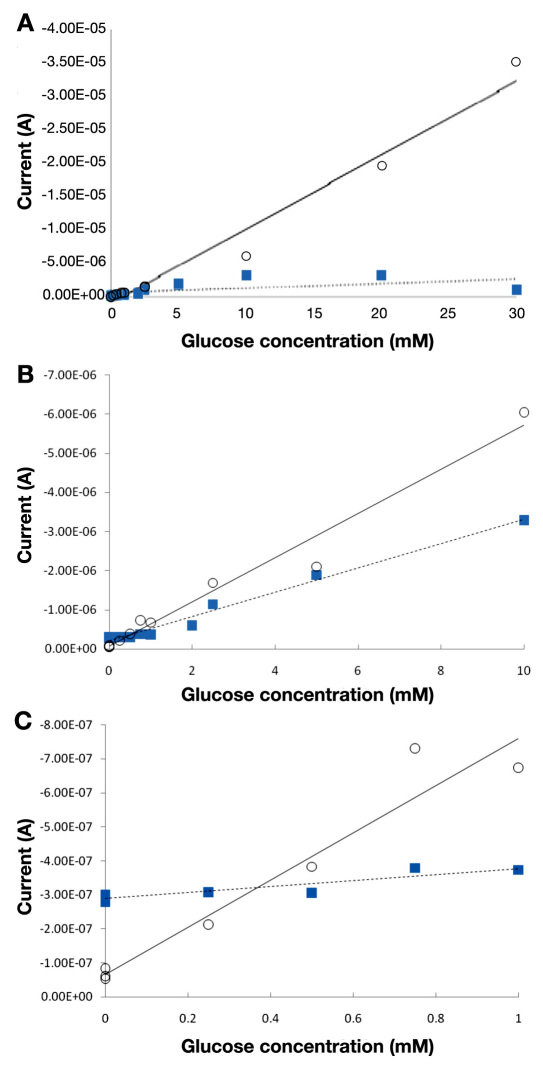
Figure 5.
(A) Comparison of GOx (squares) and GDH-FAD (circles) across the linear range of glucose dehydrogenase (0–30 mM). (B) A closer look at GDH-FAD and GOx across the 0–10 mM range, within which both GOx and glucose dehydrogenase display an acceptably linear current–glucose concentration curve. The best-fit regression equation for glucose dehydrogenase (solid line) has a slope of -5.65 × 10⁻⁷ A/mM, which is almost double the GOx (dashed line) best-fit slope of -3.11 × 10⁻⁷ A/mM. (C) An even closer look at both enzymes in the 0–1 mM range, which would be relevant for tear glucose sensing.

