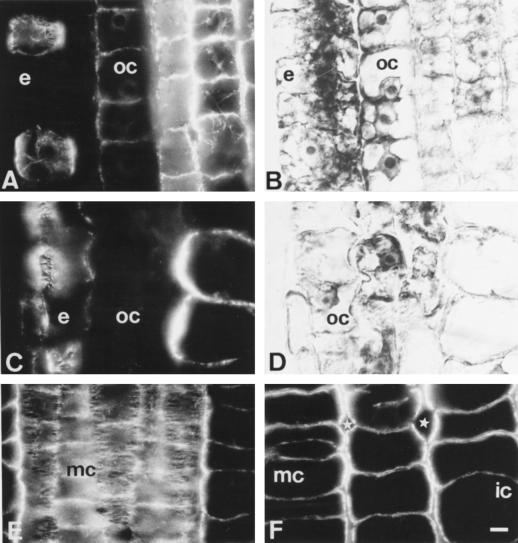
Figure 4.
Effects of long-term Al treatment (90 μm, 12 h) on MTs and cell shapes in DTZ (A and B) and proximal (C and D) part of the TZ. B and D are DIC images of A and C. Note that epidermal and outer cortex cells are already distorted in the proximal part of the TZ (C and D), whereas middle cortex cells are abnormally expanded (F). Note the presence of unusually large intercellular spaces (stars in F). Although most cells of the middle cortex have disoriented CMTs, some cells still show dense transversal arrays (E). e, Epidermis; oc, outer cortex; ic, inner cortex; mc, middle cortex. Bar = 8 μm.

