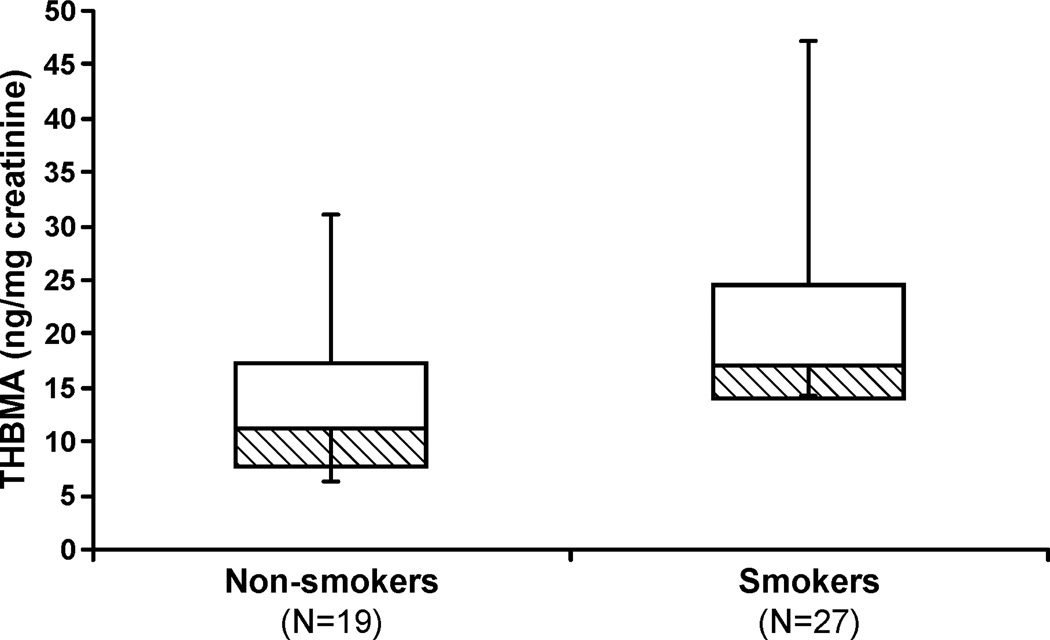
Figure 5.
Creatinine-corrected concentrations of THBMA in urine from 19 non-smokers and 27 smokers. Boxes represent the 25th and 50th percentiles; lines represent the minimum and maximum. The difference between THBMA concentrations in smokers (21.6 ± 10.2 ng/mg creatinine) and non-smokers (13.7 ± 7.9 ng/mg creatinine) is statistically significant (p < 0.01).

