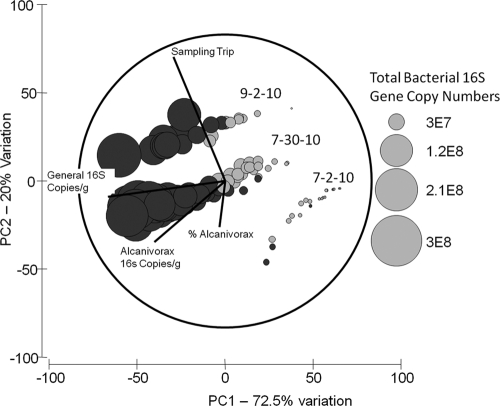
Fig. 1.
Principal component analysis of bacterial SSU rRNA gene abundance and days since oil arrival. Dark bubbles represent visibly oil-contaminated samples, whereas light ones indicate visibly clean samples. Bubble size is relative to the number of bacterial SSU rRNA gene copies per gram of sand. Vectors represent variables used to generate the euclidean distance. SSU rRNA abundance data were initially fourth root transformed to meet the assumptions of normality.

