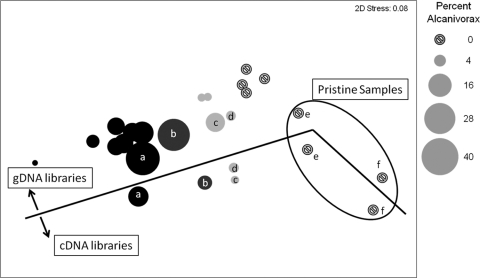
Fig. 4.
Multidimensional scaling plot of SSU rRNA pyrosequence libraries derived from oiled Pensacola Beach sands (black), clean Pensacola sands (gray), and pristine sands (gray) from St. George Island. Samples above the black line were obtained from gDNA extracts, while samples below the line were derived from total RNA extracts reverse transcribed using a bacterial SSU rRNA gene primer. Lowercase letters (a to e) indicate pyrosequence libraries derived from the same sand sample. Averaged Bray-Curtis distance is shown. Bubble size is relative to percent abundance of Alcanivorax-like OTU as assigned by the RDP classifier.

