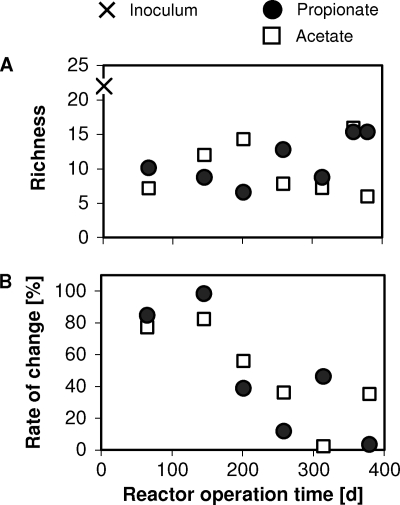
Fig. 3.
(A) Range-weighted richness as a function of reactor operation time. (B) Moving window analysis reflecting the change in the bacterial community composition. Each data point is based on a comparison between 16S rRNA gene-based T-RFLP patterns separated by a time window of 60 days (except for the point at 145 days, where the time window was 80 days).

