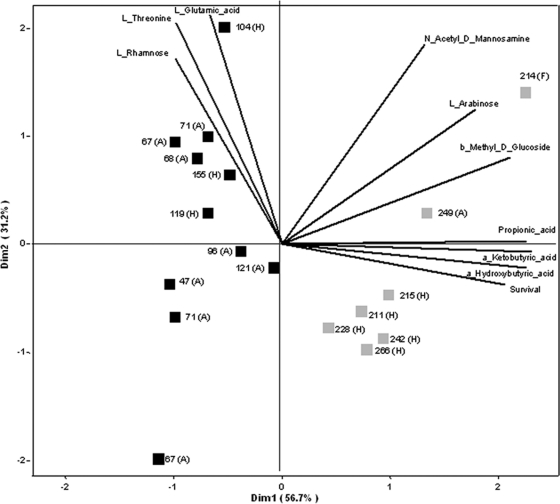
Fig. 3.
Principal component analysis (PCA) ordination diagram of Biolog data for the different E. coli O157 strains used in this study. The length and direction of the lines represent the contribution of the oxidative activity of specific substrates to the first two dimensions (i.e., the explained variance). Only substrates showing a significant different oxidative activity between both groups of short and long survivors are shown. Black squares represent strains surviving less than 200 days, and gray squares more than 200 days. The numbers represent the days of survival; the letters indicate whether the strain is from animal (A), human (H), or food (F) origin.

