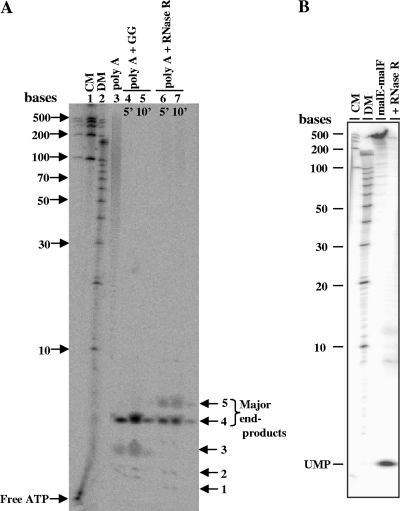
Fig. 3.
Analysis of degradation products of RNase RPs. (A) 5′-end 32P-labeled poly(A) was used as a substrate, and the degradation products were analyzed on 20% sequencing gel (8 M urea-PAGE). Lanes 1 and 2 contain RNA century markers (CM) and decade markers (DM), respectively. Lane 3 is a control (without enzyme). Lanes 4 and 5 represent the activity of the degradosomal complex (marked as GG for glycerol gradient fraction) on poly(A). Lanes 6 and 7 depict the activity of purified RNase RPs on poly(A). Limit products (end products) of degradation have been labeled with arrows. (B) 32P-internally labeled malE-malF RNA (318 nt) was used as a substrate for degradation. Samples in each lane are labeled at the top of the panel. The sizes of the molecular markers and the cleavage product of the nucleotide monophosphate (UMP) are marked.

