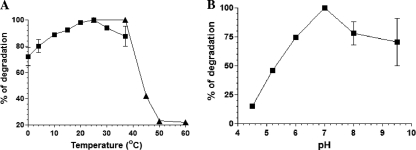
Fig. 4.
Temperature optima and heat stability (A) and pH-dependent activity (B) of RNase RPs. (A) 5′-end-32P-labeled poly(A) substrate was used for degradation in the presence of 10 ng of RNase RPs in each reaction at the indicated temperatures. Products were resolved on 8 M urea–8% PAGE, visualized by using a phosphorimager, and quantified as described in Materials and Methods. Heat stability was tested by preincubating the enzyme at the indicated temperatures (22, 37, 45, 50, and 60°C) for 5 min, and then degradation assays were performed at 22°C for quantification. Quantified values for the temperature-dependent activity (■) and heat stability (▴) of RNase RPs are plotted on the same graph. (B) pH-dependent activity of RNase RPs on poly(A). Assays were performed at 25°C. Error bars shown on graphs indicate the deviation in the values.

