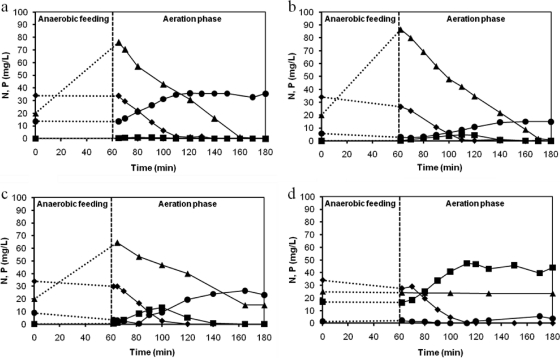
Fig. 1.
Ammonium (♦), nitrate (•), nitrite (■), and phosphate (▴) profiles acquired in the cycle measurements performed at the end of phase I (no salt) (a), phase II (11 g/liter NaCl) (b), phase III (22 g/liter NaCl) (c), and phase IV (33 g/liter NaCl) (d). The starting ammonium and phosphate concentrations depicted at time zero were calculated based on the influent concentration (60 mg/liter NH4+-N and 20 mg/liter PO43−-P) and the dilution in the reactor. Nitrite and nitrate concentrations at time zero were calculated based on their concentrations at the end of the cycle and the dilution in the reactor.

