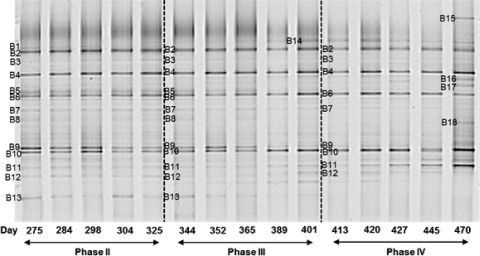
Fig. 3.
Bacterial DGGE results from phases II (11 g/liter NaCl), III (22 g/liter NaCl), and IV (33 g/liter NaCl). Five representative samples from phases II to IV were taken into account. The operational days can be seen just below gel lanes. Most of the bands indicated by a number were sequenced successfully and used for phylogenetic analysis. Some of them (particularly bands 1, 2, 3, and 16) were not taken into account due to the unsatisfactory sequencing results.

