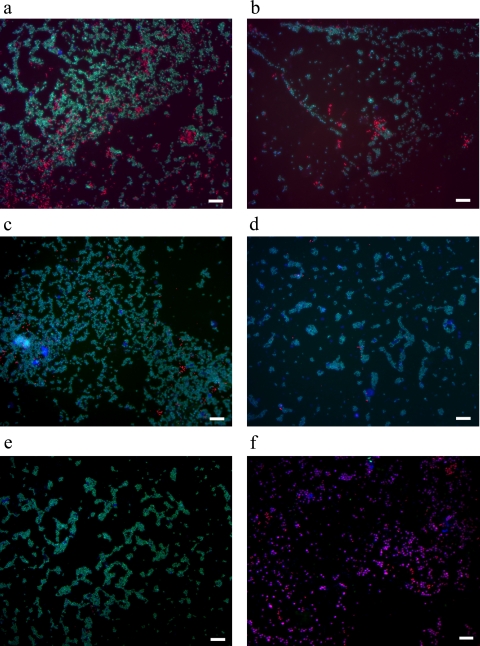
Fig. 6.
Fluorescent in situ analysis of the PAO/GAO populations among all bacteria present in the reactor at the end of phase II (a), end of phase III (b), first week of phase IV (c), second week of phase IV (d), and third week of phase IV (e) using combinations of specific probes for PAO (PAO462, PAO462, and PAO846; shown in red), GAO (GAOQ431 and GAOQ989; shown in green), and general bacteria EUB338 (EUB338I, EUB338II, and EUB338III; shown in blue). (f) Fractions of populations using probe combinations of PAO+GAO (using PAOmix/GAOmix probes; shown in red) and AOB+NOB (using combination of probes Nso1225/Nso190/Neu653/Ntspa662/Nit1035; shown in green) within the whole bacterial community (EUB338 mix) in the granules during phase II. The scale bar indicates 20 μm.

