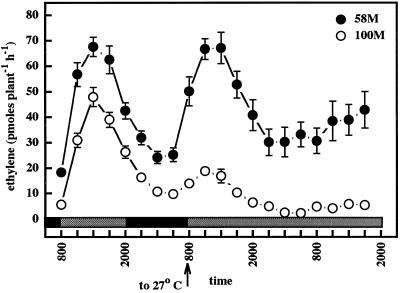
Figure 7.
Ethylene production from sorghum grown under a simulated high-shade 12-h/12-h photoperiod, 31°C/22°C thermoperiod until 8 am of d 6, then given constant simulated high shade at 27°C. The first sample was from 5-d-old plants (58M is phyB-1, 100M is PHYB). n = 5, means ± se. Gray and black bars indicate shaded light/warm and dark/cool periods, respectively.

