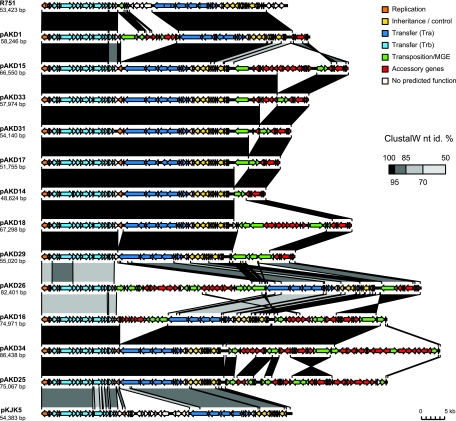
Fig. 2.
Alignment of 12 pAKD plasmids showing their evolutionary relationship to each other and to the well-known IncP-1 plasmids R751 and pKJK5. Coding regions are shown as colored arrows; putative functions are indicated by the color key (top right). The degree of similarity between plasmids (percent nucleotide identity of alignments performed using ClustalW) is indicated by grayscale-shaded regions; the darker the shading between two segments, the higher their similarity, as shown in the heat key (middle right).

