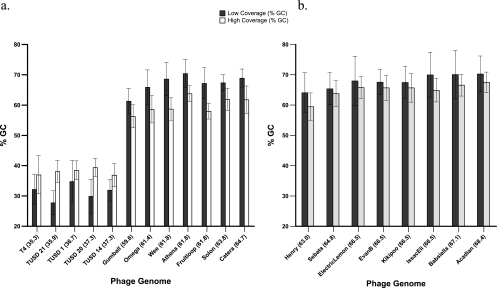
Fig. 5.
Average GC content (± SD) of regions with low or high coverage in comparisons of individual phage genomes. (a) Phage comprising the mock metagenome and unknown phage genomes prepared using the Nextera protocol. (b) Mycobacteriophage genomes prepared using the Roche GS FLX Titanium general library preparation method. Values in parentheses after the phage name indicate the average % GC content of the genome. Classification of the results into low- and high-coverage areas corresponded to the regions above or below 1.5 standard deviations from the average coverage. Genomes with at least 5 regions of low and high coverage of 50 bp or longer were included in the analysis.

