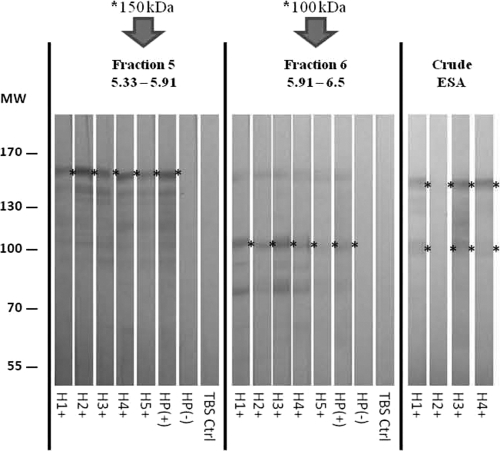
Fig. 4.
IgG blot of ESA separated by 2-DE and probed with human serum samples. H1+ to H5+, individual ALA serum samples from group B; HP+, pooled ALA serum sample (positive control); HP−, pooled IHA-negative serum sample (group D). Ctrl, control; MW, molecular weights in thousands. pI values are indicated for the fractions.

