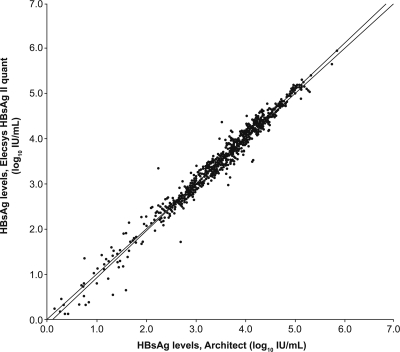
Fig. 5.
Overall correlation between Elecsys HBsAg II quantitative and Architect HBsAg assays (n = 611). x axis, HBsAg comparison assay (log10 IU/ml); y axis, Elecsys HBsAg II quantitative assay (log10 IU/ml). Passing/Bablok, y = 1.04x − 0.13, τ = 0.900; linear regression, y = 1.03x − 0.10, r = 0.988. The sample concentrations were between approximately 0.11 and 873,300 IU/ml.

