
Fig. 3.
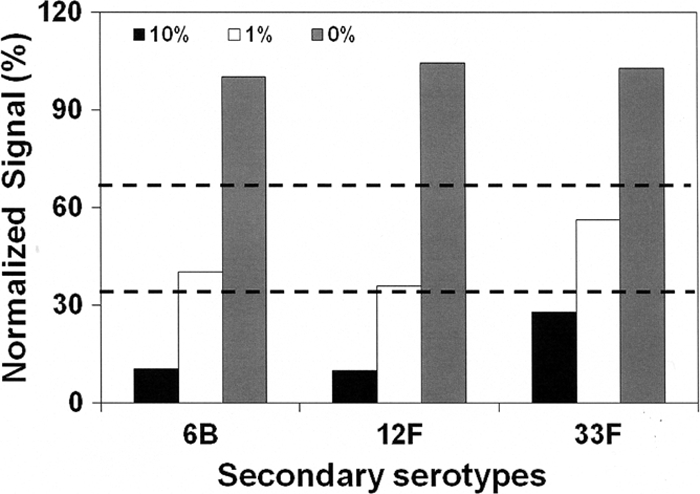
Normalized signals for the secondary serotypes in three samples. The abundances of the secondary serotypes are 10%, 1%, and 0%. Two dashed horizontal lines at 33% and 67% are used for decision making.
Official websites use .gov
A
.gov website belongs to an official
government organization in the United States.
Secure .gov websites use HTTPS
A lock (
) or https:// means you've safely
connected to the .gov website. Share sensitive
information only on official, secure websites.
Normalized signals for the secondary serotypes in three samples. The abundances of the secondary serotypes are 10%, 1%, and 0%. Two dashed horizontal lines at 33% and 67% are used for decision making.