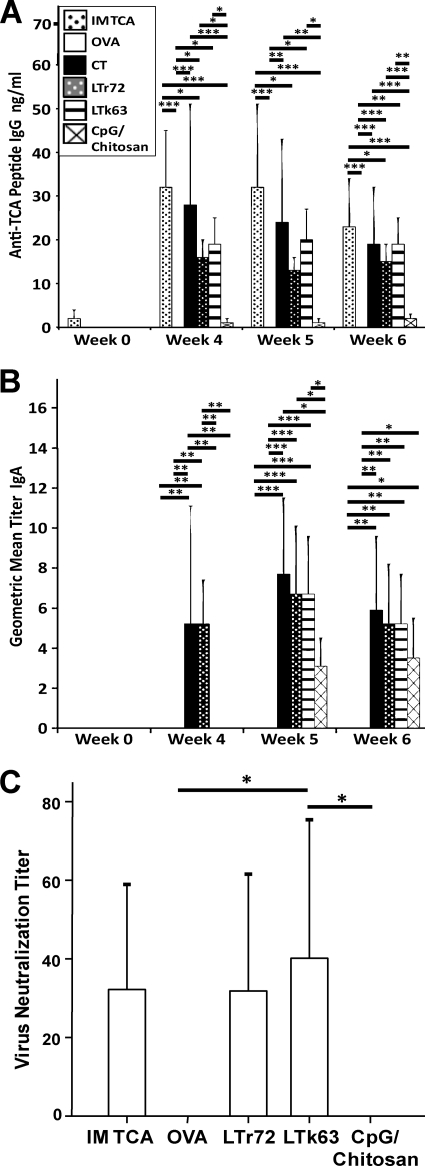
Fig. 1.
Antigen-specific humoral immune responses. Anti-FMDV peptide serum IgG (A) and mucosal IgA (B) antibody responses, as measured by ELISA (one animal from the group given CT as an adjuvant died before completion of the study and was not included in any analyses). IgG concentrations were interpolated from a standard curve, and IgA concentrations are expressed as a geometric mean titer (endpoint titer determined to have an absorbance two times higher than background). IM TCA, i.m. TCA peptide. (C) Virus neutralizing titers as measured by plaque reduction assay (CT was excluded from the analysis, as statistics were impeded by the dramatically skewed data distribution of this group [only one animal in this group had measurable VNT, but it was the highest in the study at 1:130]). The bars represent the mean responses, and the error bars indicate 1 standard deviation from the mean. Horizontal black bars indicate pairwise comparisons between groups with significance denoted by asterisks as follows: *, P < 0.05; **, P < 0.01; ***, P < 0.001.

