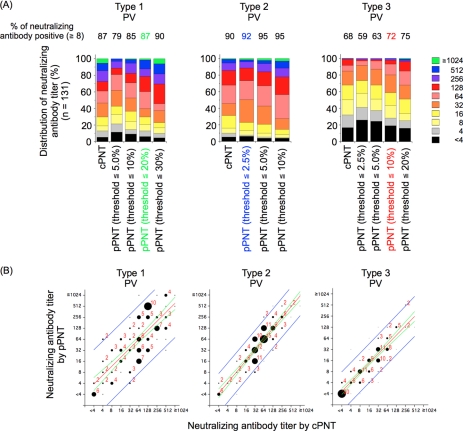
Fig. 3.
Determination of threshold values for each type of PV in pPNT for human sera. (A) Distribution of neutralizing-antibody titers in human serum samples (n = 131) determined by pPNT in a range of threshold values. The results were compared with those obtained by cPNT. The neutralizing-antibody-positive rates of the samples were determined for each threshold value and are shown above the graphs. The threshold values that showed neutralizing-antibody-positive rates closest to those obtained by cPNT are highlighted with color for each type of PV (green, 20%; blue, 2.5%; and red,10% for type 1, 2, and 3 PV, respectively). (B) Scatter plots of neutralizing-antibody titers obtained by cPNT and pPNT. The threshold values used in pPNT were 20%, 2.5%, and 10% for type 1, 2, and 3 PV, respectively. The numbers of the serum samples in the corresponding spots are visualized by the sizes of the circles, along with the number of the sample for each spot when more than one sample was in the same spot. The regression line (red), 95% confidence interval (green), and 95% prediction interval (blue) of the analyses are shown.

