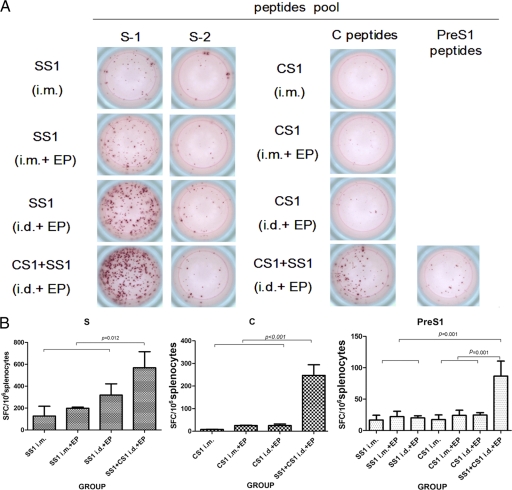
Fig. 5.
ELISpot analysis of IFN-γ secretion in mouse splenocytes immunized with HBV DNA vaccines as indicated. (A) Sample wells with spots with mock or HBV peptide stimulation. (B) Frequencies of HBV peptide-specific spots per million splenocytes in HBSS1, HBCS1, or combined vaccine (HBSS1- HBCS1)-immunized mice. The data represent the average numbers of SFCs per million splenocytes from 6 mice/group plus standard deviations. The splenocytes were collected 4 weeks after the 3rd DNA immunization.

