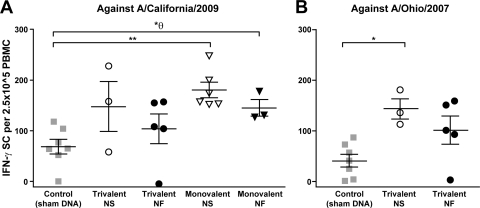
Fig. 3.
DNA vaccination elicits IFN-γ responses measured by an ELISpot assay with PBMCs collected 1 week prior to H1N1 challenge. An ELISpot assay was used to detect cells secreting IFN-γ against A/California/2009 and A/Ohio/2007 in vaccinated animals. Results are presented as single data points in a group, with lines indicating the mean and standard error of the mean (SEM) for each group. A Mann-Whitney t test was used for statistical analysis comparing values between immunized and nonimmunized control animals. P values of less than 0.05 are indicated: * represents a P value between 0.05 and 0.001, while ** indicates a P value of ≤0.001. θ indicates a value that is nonsignificant when Bonferroni's adjustment is applied.

