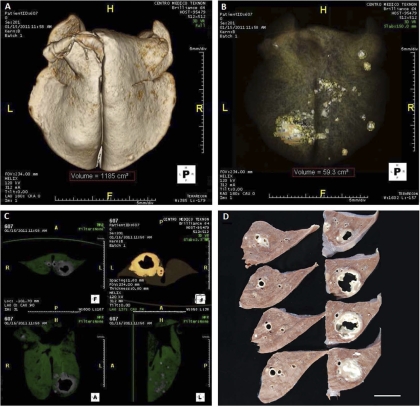
Fig. 3.
Gross pathology analysis of a goat case. (A) MDTC-3D representation of the whole lung after excluding air (H, head; F, foot, L, left, R, right). The total volume of the lung was calculated in cm3 and is shown in the red dashed box at the bottom. (B) Volume-rendering image of the lung showing different tissue densities discriminated by color: water, gray; air, black; calcium, white. The volume of affected lung is also shown. (C) Pathological areas identified by segmentation in axial (top; A, anterior; P, posterior), coronal, and sagittal (bottom) planes. (D) Formalin-fixed, 5-mm sections of the left diaphragmatic lobe showing a large cavitary lesion. Cranial to caudal sections are represented as bottom up and left-right. Bar = 3 cm.

